
What is the environmental impact of Hedgehog? That's a good question, and to answer it, Marijn Kansen (Junior Sustainability Expert) has calculated our Carbon Footprint. This Carbon Footprint is the sum of all greenhouse gases emitted by our company's activities in 2023.
This is an example of a Carbon Footprint calculation. Contact us if you want to know how you can calculate your Carbon Footprint.
We calculated our Carbon Footprint for the year 2023 using the CO2 emission factors database, the Environmental Impact of Food Database (RIVM), Ecoinvent v3.8, Exiobase, and the Defra UK GHG emission factors.
In short; what is a Carbon Footprint?
In summary, the Carbon Footprint is the sum of all greenhouse gas emissions released by your business activities. This results in a number expressed in units of CO2-eq, CO2 equivalent. You can calculate this footprint weekly, monthly, or annually. This Carbon Footprint is not a static "endpoint," but is constantly changing. To keep your footprint up-to-date, you must continuously update it with your new emissions.
If you want to learn more about CO2, CO2-eq, and your footprint, read our article at hhc.earth/knowledge-base/whats-it-all-about-with-co2
How big is the Carbon Footprint of Hedgehog?
In 2023, the Carbon Footprint of Hedgehog was 16 tons CO2-eq, 16,000 kg CO2-eq.
To put this in perspective, 16 tons CO2-eq is equivalent to the emissions associated with:
- +- 10 round trips by plane from Amsterdam to New York, per passenger
- 3300 black cotton T-shirts
- 761,905 cups of coffee
(https://translator.ecochain.com/)
Joost Walterbos, Co-Founder; “Our Carbon Footprint is 16 tons CO2-eq. Is this a lot or a little? This number alone doesn’t tell us much. It’s more interesting to understand how these 16 tons are composed. What share are scope 1, 2, and 3 emissions? Is our impact growing or shrinking over time? And what impact can we personally affect? By making different choices where possible, we can ensure that certain emissions are reduced next year.”
Impact of Scope 1, 2, & 3 emissions
The emissions that need to be included in your Carbon Footprint calculation are precisely defined in the Greenhouse Gas Protocol (abbreviated as GHG Protocol). According to the GHG Protocol, you must calculate your Carbon Footprint for the emissions that occur in your scope 1, 2, and 3.
Scope 1 emissions are your 'direct emissions'. These are the greenhouse gas emissions from sources that your company owns or controls.
19% of our Carbon Footprint arises from our scope 1 emissions; specifically, 3 tons CO2-eq.
Scope 2 emissions are your 'indirect emissions'. These are emissions associated with the energy purchased and used by your company.
25% of our Carbon Footprint arises from our scope 2 emissions; specifically, 4 tons CO2-eq.
Scope 3 emissions are the emissions associated with the activities of the entire value chain, both upstream and downstream. These emissions are beyond the direct control of your company, but almost always constitute the largest share of your Carbon Footprint.
A whopping 56% of all our emissions originate from our scope 3 emissions; 9 tons CO2-eq.

What data did we use to calculate our carbon footprint?
Scope 1
We calculated using average CBS data per square meter of office space.
Scope 2
As we are in a shared office, we do not have insight into our exact energy consumption. Therefore, we used averages from the CBS.
Scope 3
Scope 3.00 Working from Home: For remote working, we requested data on energy consumption and specific energy contracts from employees. For home heating, we used standard values.
Scope 3.1 Purchased Goods and Services: Calculated using receipts, which were then extrapolated and linked to emission factors. For the supermarket, we made quite specific calculations, linking all individual grocery purchases over several weeks to the emission factors from the Environmental Database (RIVM) and extrapolating these results to the entire year.
Scope 3.4 Upstream Transportation: We calculated the emissions for transporting purchased goods from distribution centers to the office.
Scope 3.5 Waste: We weighed the waste for two weeks and extrapolated this to the entire year.
Scope 3.6 Business Travel: We used all the information about business trips (mode of transport, traveled kilometers, and hotel stays) to determine the impact of these trips.
Scope 3.7 Commuting: We collected information via a survey from all employees.
Scope 3.11 Use of Sold Products: We gathered information from the Google Cloud Console.

Where is our greatest impact, our environmental hotspots?
56% of our environmental impact arises in scope 3. What causes this environmental impact?
The GHG Protocol has defined various subcategories within which you calculate your scope 3 emissions; think, for example, of waste, purchased products, and the commute of your employees. In the image below, you can see how our impact is distributed across different categories.
Let's zoom in on a few notable findings.
Scope 3.1: Purchased goods and services
4 tons, 41% of all our emissions in scope 3, come from this category. And these Scope 3.1 emissions constitute 23% of our total Carbon Footprint.

More specifically, where does this impact occur?
- 31.4% are emissions from our supermarket groceries.
- 15.2% are emissions from purchased electronics (laptops, etc.).
- 12.2% are emissions related to drinks we have bought in hospitality venues. Corporate outings, well, we love them ;)
Our groceries consist of food for our lunch (bread, toppings, vegetables & fruit), coffee & tea, and snacks. Our lunches are completely vegetarian and partly vegan.
Something that stands out is the impact created by the amount of cheese we purchase. With 21 colleagues, we consume a significant amount of cheese: 27.23 kg in 2023. This corresponds to an impact of 351.64 KG CO2-eq. This is 30.82% of all Scope 3.1 emissions, 4% of all Scope 3 emissions combined, and 2.25% of our total Carbon Footprint.
.webp)
The impact of our other sandwich toppings is much smaller;
- Sweet spreads contribute with 0.123 tCO2-eq (123 kg CO2-eq) 10.8% to the Scope 3.1 emissions
- Savory spreads (vegetable spreads, vegetarian meat substitutes, etc.) contribute with 0.189 tCO2-eq (189 kg CO2-eq) 16.6% to the Scope 3.1 emissions
Scope 3.7: Commuting by employees
Our organisation has grown significantly over the past year; currently, we have 21 colleagues. Not all of these colleagues live next to our office, so quite a few kilometers are traveled; the total distance in 2023 was 58,502 km for the whole year, 1,271 km per week.
Of these kilometers, 93% are traveled emission-free, by train or bicycle.

In total, the impact of our commuting in 2023 is 2.1 tons of CO2-eq, 13 % of our total carbon footprint. A notable finding is that a whopping 82.4% of those 2.1 tons, namely 1.7 tons of CO2-eq, comes from the ferry that connects Amsterdam North with the rest of Amsterdam. We did not expect this mode of transport to have such a significant environmental impact!
Fortunately, the municipality of Amsterdam has ambitions to make this ferry more sustainable: three old diesel ferries will be replaced by four new electric ferries over the course of 2024. Eventually, the city aims to make all ferries completely emission-free .
Conclusion: how can we reduce our impact?
Once you have calculated your carbon footprint, you know where your impact lies. Part of this impact can be reduced, but unfortunately not all of it. Sometimes you simply need certain raw materials to make your product, even if these materials cause a significant environmental impact. Or you might not have control over, for example, the energy provider for your office.
The steps you can take to reduce your impact will vary depending on the organisation and situation.
Emissions beyond our control at Hedgehog
Hedgehog doesn't produce goods but provides services. For service organisations, reducing emissions can be more challenging than for manufacturing firms because they involve fewer purchases and "fixed components" like transport or machinery—areas where it's often easier to opt for sustainable alternatives.
In our case, we rent office space in a shared building, leaving us with no control over the chosen energy provider. Thus, switching to green energy isn't an option for us. Centralized temperature control and lighting also limit our ability to influence energy consumption significantly.
Furthermore, in Scope 3.7 'Commuting,' the ferry to and from Amsterdam-Noord turned out to be a significant source of emissions. Annually, this accounts for 1.7 tons of CO2-eq. We are thrilled about Amsterdam's ambitions to make the ferry more sustainable! But until these changes are implemented, there is little we can do to reduce these emissions unless our colleagues fancy swimming.
Our team members predominantly commute by bicycle or public transport. However, for some distances and connections, this poses a challenge. Therefore, one of our colleagues opts for her car half of the time. Her travel time by car is 60-90 minutes, compared to 110-120+ minutes by public transport, during which she can work from the train.
Occasionally, we use a car when visiting clients. We don't have company cars, relying instead on two private cars owned by our colleagues. These are not electric, thus contributing to our Carbon Footprint. Electrifying these trips could reduce our impact from 744 kg of CO2-eq down to 286 kg of CO2-eq.
And last, for business travel, we've chosen buses or trains whenever possible, out of a commitment to sustainability. Yet, on one occasion, a lack of train connectivity forced us to fly, adding 0.3 tons of CO2-eq (259 kg CO2-eq) to our total carbon footprint.

What we do to keep our environmental impact as low as possible
Where we do have control over our environmental impact, sustainability naturally plays a significant role.
For instance:
Our interior. We have primarily purchased our office furniture second-hand, including chairs, carpeting, and glass partitions. Our second-hand desks were picked up for free and therefore are not included in our emission calculations as they do not fall under purchased goods.
Our laptops. We buy second-hand or refurbished laptops, which make up 38% of all our purchased electronics. However, items like monitors, webcams, and microphones are bought new.
Our menu. Given the high environmental impact of meat, our lunches are vegetarian and partly vegan. Completely eliminating cheese could save an additional 0.2 tons of CO2-eq, but even for our sustainable team, this is a hotly debated topic.
Our groceries. We buy precise and small quantities to combat food waste and opt for bulk packaging when possible to reduce packaging material. Part of our shopping is done through Pieter Pot, a plastic-free supermarket that uses reusable glass jars as packaging.
Our waste. We separate paper, glass, and residual waste. In 2023, we "produced" 410 kg of waste, of which 290 kg was residual waste. Per full-time employee, this amounts to 39 kg, well below the average of 84 kg/FTE.

Calculate your own Carbon Footprint
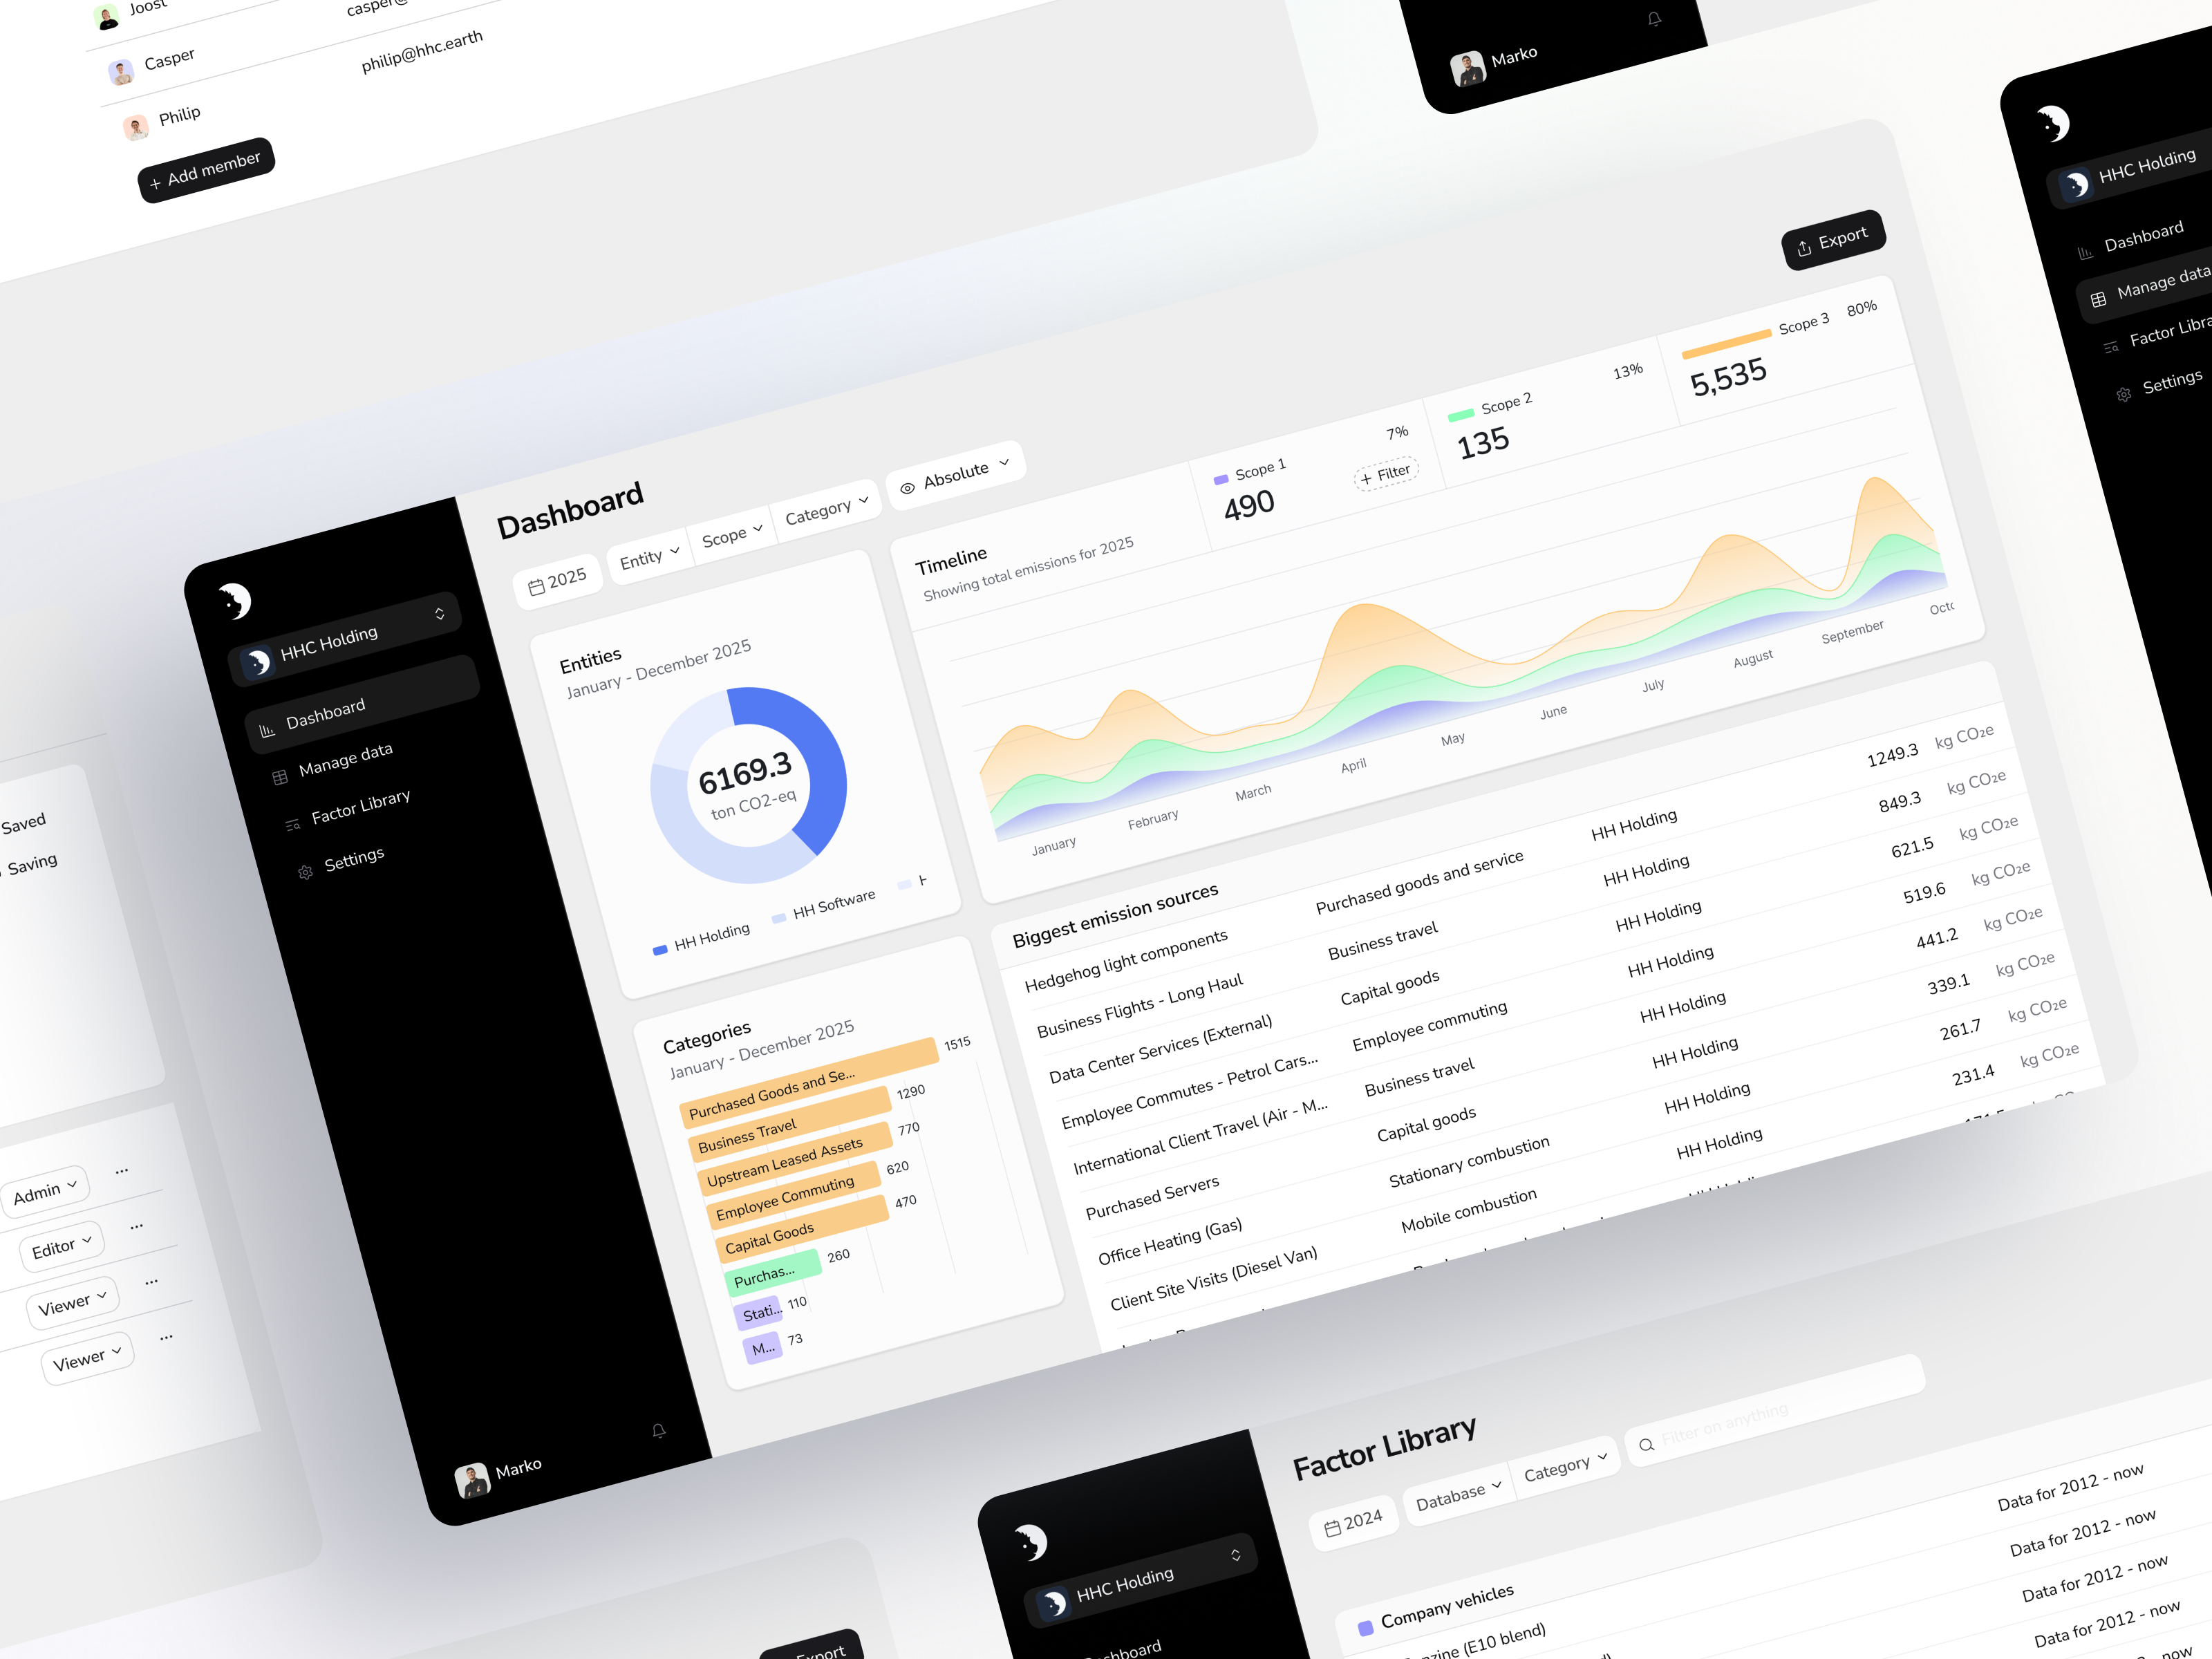
After reading this article, if you wish to calculate your own carbon footprint, you can do so using the Hedgehog Carbon Platform. It's important to choose a period (month, year) and have all necessary data available to fully report on your Scope 1, 2, and 3 emissions.
We can also perform the calculation for you. Please contact us using the button below.


